Dashboards
- Modules
- Connectors
- Audio
- Calendar
- Clock
- Countdown
- Currencies
- Dashboard
- DataSet
- Embedded
- Emergency Alert
- Flash
- Google Traffic
- HLS
- HTML Package
- Image
- Local Video
- Mastodon
- Menu Board Category
- Menu Board Products
- National Weather Service
- Notifications
- PowerPoint
- Shell Command
- Stocks
- Ticker
- Video
- Video In
- Weather
- Webpage
- World Clock
On this page
Dashboards
The Dashboards Widget is used to display Dashboards that have been configured to use the Xibo Dashboards Service
Please note: This commercial Widget is part of the Xibo Dashboard Service and requires an API for configuration as further explained here
- Dashboards
- Available from CMS: 3.2
- Dashboards 3.2
- Cloud: API Key Required
Configuration
- Select the dashboard service to match the dashboards that have been configured in the connector.
- Enter the URL to embed.

- Provide an update interval in minutes.

On first entering a URL into the Dashboard Widget it may take a few moments to load as it is dependent on how long it takes to render your dashboard content, and how busy the service currently is.
Once you are showing your dashboards on displays, the service will keep your dashboards updated at the interval you specify so it will always be ready to show and appear instantly on Displays.
If you stop showing a dashboard on your displays for a time, then the service will stop refreshing it, but will start again automatically the next time that dashboard is shown.
By default reports in Power BI render with a US Date format. To use an alternative date format add the following parameters to the URL you pass in the Dashboards Widget as shown with the example below for en-GB:
&language=en&formatLocale=en-GB

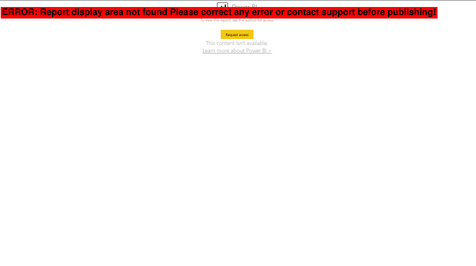
Please note: If Xibo detects an error with a request for dashboard services, you will see a red banner message over the top of a screengrab to give an indication to the user where the problem has occurred. This will be shown in the Layout Designer previewer only for the logged in user. The Layout Preview and Displays showing the scheduled Layout will continue to show the last good capture or a spinner icon until the issue has been resolved.
Example Error message with screengrab shown below:


