
Xibo Dashboard Service
On this page
Xibo Dashboard Service
The Xibo Dashboard connector is an add-on service from Xibo Signage which enables simple and secure connection to a variety of 3rd party services. We securely connect to the 3rd party, save your credentials and capture dashboards for display on your signage network.
Enable this service with an API key from Xibo Signage
Please note: This commercial feature is available from v3.2.0 and is included with both the Business and Enterprise Plans. If you are on the Professional Plan or use a self-hosted CMS the Xibo Dashboard Connector is available for purchase separately. Further information can be found on our website
Once purchased, an API key will be made available in My Account which is used to Configure the Connector for the Xibo Dashboard Service.
If your CMS is hosted in our Cloud the connector will be available in your CMS on upgrading to v3.2.0.
If you are a Business or Enterprise customer your API key will be pre-filled for you.
https://api.dashboards.xibosignage.com and https://xibo-dashboard.fra1.digitaloceanspaces.com for the Dashboard Connector to function! Players do not directly contact the Xibo Dashboard Service.
The Dashboard Service api.dashboards.xibosignage.com also requires access to the 3rd party providers you wish to connect to.
3rd party services behind a firewall will not work unless access can be granted.

Configuration also requires a User to supply dashboard credentials in the CMS for Xibo to authenticate with the 3rd party service. Xibo does not store these credentials in the CMS. They are securely stored and encrypted in our credential manager.
We strongly recommend that you use a dedicated account for Xibo to log in to your 3rd party services with. This is sometimes referred to as a service account. This account should only have access to the dashboards that you wish to show with the Xibo Dashboard service, and should not use credentials that can be used for any other service.
Once the Connector has been successfully configured, Users can add Dashboards to display in Layouts using the Dashboards Widget

Once you are showing your dashboards on displays, the service will keep your dashboards updated at the interval you specify so it will always be ready to show and appear instantly on Displays.
If you stop showing a dashboard on your displays for a time, then the service will stop refreshing it, but will start again automatically the next time that dashboard is shown.
Operation and Security
Showing “dashboard” style content has long been desirable in the digital signage world, however doing so securely has always been problematic.
Each vendor has its own authentication system, and those which offer a way to embed content directly involve making that data available at a public URL, which is not very secure in itself.
Those embed pages often use large amounts of javascript and require a powerful computer to render properly. The class of devices used for digital signage players is often a lower power Android or SoC device, or lower spec Windows PC, and they are not capable of rendering that content in a reasonable timeframe.
Xibo has developed its own Dashboards service, which allows you to input the URL of a report or dashboard you want to show within a supported service, and have that shown on your Players without the Players needing to have credentials to access that service, and with that content rendered quickly and efficiently.
To enable this, users Configure Credentials for the service they wish to use inside their CMS. Passwords and TOTP secrets are securely encrypted (using AES 128 bit CBC with a SHA-256 HMAC) and stored inside Xibo’s Dashboard Service. They are not held in the CMS, and once input it’s impossible to retrieve them again from the CMS.
Users then configure the dashboards that they want their displays to show, and the dashboard service will log in to that service on your behalf, load the content you’ve asked it to show, and then send a static image capture of that dashboard and store it on encrypted storage within DigitalOcean’s Spaces service.
When a display wants to show that dashboard, it requests it from the CMS which will authorise or reject the request, and if authorised it will connect to the Xibo Dashboard Service and download the latest image and pass it to the Player, without storing it in the CMS or on the Player storage.
Provided the Player connected to your CMS continues to request that dashboard periodically then the Xibo Dashboard Service will continue to keep the stored image updated at the interval you specify.
If you stop requesting a specific dashboard, then the service will stop updating that stored image after 10x the interval you’ve specified and will delete it completely after a period of 20x the interval.
Our Dashboards service is run from Hetzner’s Falkenstein data centre and DigitalOcean’s Frankfurt data centre, and you will see connections to the services you configure coming from an IP in those locations. This is normal.
All users of the CMS for which the Dashboards connector has been enabled can use the connector to show dashboards from that service. You should not install the Dashboards connector on a multi-tenanted CMS since you cannot prevent users from one tenant from accessing services authenticated by another within the same CMS.
It’s not possible to store multiple credentials for each service type inside the same CMS instance.
Dashboard Service Providers
Power BI
Obtaining a URL
You can use the page URL for your Report directly inside Power BI.
If you need to pre-configure options within the Report:
- Set those options and then bookmark that using the bookmark icon at the top right of the screen.
- Select “Add a personal bookmark” and then give the bookmark a name:
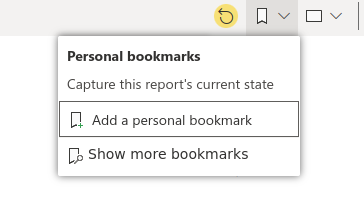
- Go back to the bookmark menu and select your bookmark.
- Copy the URL from your browser and use that with the Dashboard service.
&chromeless=true to the end of the URL.
Supported authentication mechanisms
The Xibo Dashboard Service supports the native Power BI authentication mechanism using your Microsoft Account, including a TOTP based second factor authentication code. We do not support the two factor method for Microsoft Authenticator.
This service does not support SAML-based login.
Please ensure the user credentials you provide will work at https://app.powerbi.com
Limitations
Your report must load within 60 seconds of the report URL being opened in the browser. Some reports that use Direct Query may take longer than this. In that case, the report will be captured at the 60 second mark and the resulting image returned.
Grafana
Obtaining a URL
- Log in to Grafana and open the dashboard you wish to show.
- At the top right of the screen change the “Refresh” interval to 5m. This is so if your dashboard takes a long time to load fully, some elements are not trying to refresh before the first elements have fully loaded.
- Click the “Cycle View Mode” button once to remove the menus and again if you want to remove the dashboard title.

- Refresh settings.
- Copy the page URL and use this with the Dashboard service.
Press your Esc key to return to the standard view.
Supported authentication mechanisms
The Xibo Dashboard service supports Grafana Cloud’s native authentication, and locally installed Grafana instances using the built-in authentication mechanism.
It does not support logging in with OAuth providers (Microsoft, Google, Github etc).
Grafana does not support multi factor authentication, so please leave the Secret field empty when configuring this integration.
Limitations
Your dashboard must load within 60 seconds of the dashboard URL being opened in the browser. If your dashboard takes longer than this, the dashboard will be captured at the 60 second mark and the resulting image returned.
Matomo
Obtaining a URL
- Load the Dashboard you wish to show inside your Matomo instance.
- Copy the page URL from your browser address bar.
By default, the Matomo dashboard shows data for the previous day. If you want to adjust it to show today instead, substitute the word “yesterday” for “today” in the URL in both places, so for example the above URL becomes:
Supported authentication mechanisms
The Xibo Dashboard service supports the built-in Matomo authentication including a TOTP based second factor authentication code. It does not support any external authentication system.
Limitations
Your dashboard must load within 60 seconds of the dashboard URL being opened in the browser. If your dashboard takes longer than this, the dashboard will be captured at the 60 second mark and the resulting image returned.
